As https://learn.microsoft.com/en-us/windows-server/networking/technologies/pktmon/pktmon puts it:
Packet Monitor (Pktmon) is an in-box, cross-component network diagnostics tool for Windows. It can be used for packet capture, packet drop detection, packet filtering and counting.
Nice thing about it is that it is present by default on all modern Windows versions, so you can do a quick packet capture when troubleshooting an application issue on a Windows server that doesn’t have Wireshark installed. (You know how it sometimes goes when you suggest installing new software to an important application server in the middle of a troubleshooting session?)
Let’s do a quick demo about using Packet Monitor on a Windows 10 laptop. I start by opening a PowerShell terminal as administrator (if you try to use Packet Monitor without elevated access you will get a “Failed to communicate with the PktMon driver. The system cannot find the file specified.” error), and setting up two filters: I’ll capture all DHCP packets and also all ICMP packets.
PS C:\Users\Markku\Desktop> pktmon filter list
Packet Filters:
    None
PS C:\Users\Markku\Desktop> pktmon filter add -p 67
Filter added.
PS C:\Users\Markku\Desktop> pktmon filter add -t icmp
Filter added.
PS C:\Users\Markku\Desktop> pktmon filter list
Packet Filters:
     # Name    Protocol Port
     - ----    -------- ----
     1 <empty>            67
     2 <empty> ICMP
PS C:\Users\Markku\Desktop>
Note that the filters are handled with “or” logic: this captures packets that have port number of 67 (either source or destination, it doesn’t make a difference) OR are ICMP packets.
All “pktmon xxx” commands have also “help” subcommand available, so you can run “pktmon filter add help” to get instructions on how to use all the options.
I’ll then get the list of network adapters because I’ll capture only traffic on a specific NIC:
PS C:\Users\Markku\Desktop> pktmon list

Network Adapters:
   Id MAC Address       Name
   -- -----------       ----
   12 E8-6A-64-44-7B-00 Intel(R) Ethernet Connection (4) I219-V
   11 8C-8D-9F-55-6E-54 Generic Mobile Broadband Adapter
   13 1C-1B-B5-44-C2-7F Intel(R) Dual Band Wireless-AC 8265

PS C:\Users\Markku\Desktop>
The adapter with ID of 12 is the one I’ll be using.
While still having the network cable unplugged I’ll start the capture with “pktmon start” command:
PS C:\Users\Markku\Desktop> pktmon start -c --comp 12 --pkt-size 0 -f cap1.etl

Logger Parameters:
    Logger name:        PktMon
    Logging mode:       Circular
    Log file:           C:\Users\Markku\Desktop\cap1.etl
    Max file size:      512 MB
    Memory used:        256 MB

Collected Data:
    Packet counters, packet capture

Capture Type:
    All packets

Monitored Components:
    Id Driver       Name
    -- ------       ----
    12 e1d68x64.sys Intel(R) Ethernet Connection (4) I219-V

Packet Filters:
     # Name    Protocol Port
     - ----    -------- ----
     1 <empty>            67
     2 <empty> ICMP
PS C:\Users\Markku\Desktop> pktmon counters
All counters are zero.
PS C:\Users\Markku\Desktop>
Packet size of zero means capturing full packets (instead of the default 128 first bytes of the packets). The --comp (“component”) option was used to select a specific network adapter, but also --comp nics could have been used to capture on all network adapters. The file will be Packet Monitor’s own ETL format.
Now I’ll connect the network cable, wait a moment for DHCP to do its job and run a “ping 1.1.1.1” command.
After that I’ll see the counters and stop the capture:
PS C:\Users\Markku\Desktop> pktmon counters

Intel(R) Ethernet Connection (4) I219-V
 Id Name        Counter Direction Packets Bytes | Direction Packets Bytes
 -- ----        ------- --------- ------- ----- | --------- ------- -----
 12 Intel(R)... Upper   Rx              6   980 | Tx              7 1 346

PS C:\Users\Markku\Desktop> pktmon stop
Flushing logs...
Merging metadata...
Log file: C:\Users\Markku\Desktop\cap1.etl (No events lost)
PS C:\Users\Markku\Desktop>
I have now used Packet Monitor to capture the packets, but my usual cases will still use Wireshark for the packet analysis, after having copied the capture file off the Windows server for example (where I didn’t have the possibility to use Wireshark for capturing the packets).
Wireshark doesn’t understand the ETL files, but Packet Monitor can convert the file to the standard PCAPNG format:
PS C:\Users\Markku\Desktop> pktmon etl2pcap cap1.etl --out cap1.pcapng
Processing...

Packets total:       13
Packet drop count:   0
Packets formatted:   13
Formatted file:      cap1.pcapng
PS C:\Users\Markku\Desktop>
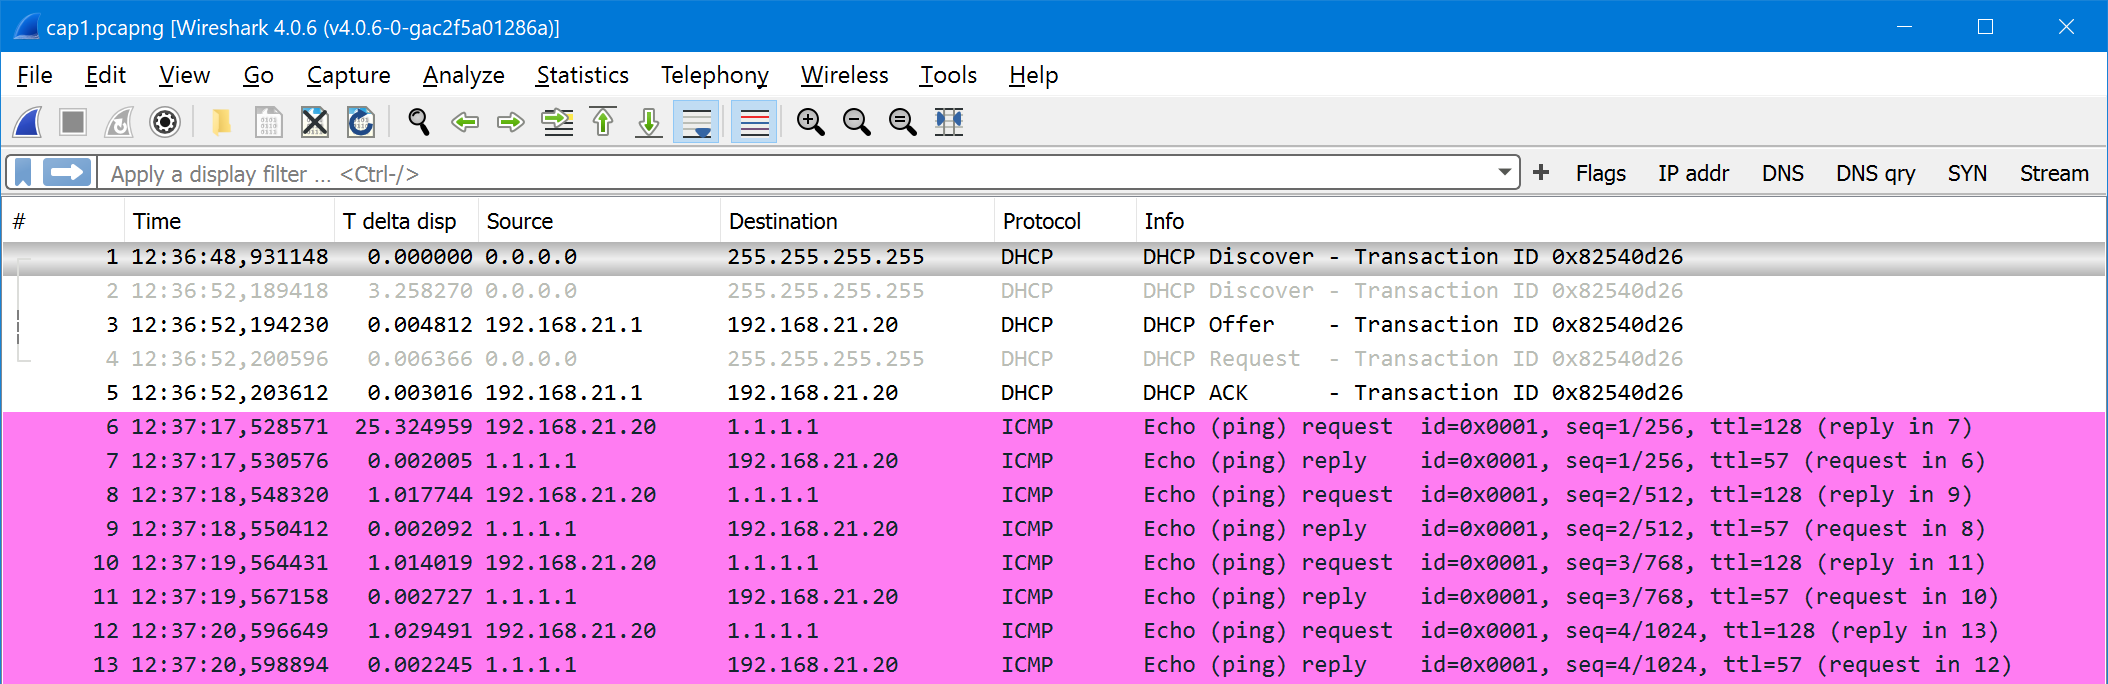
Now I can copy this file to my workstation and see the packets in my usual Wireshark workflow:
Unknown command ‘etl2pcapng’. See pktmon help.
> pktmon etl2pcap
pktmon etl2pcap [–out ] [–drop-only] [–component-id ]