I’ve done countless troubleshooting sessions so that I’m having Wireshark open with a relevant capture file and either I’m showing my findings to the other participants or doing straight up live packet analysis. Sometimes the sessions are followed up with questions about how did I actually have Wireshark configured because it looked different on their computers. This post is a quick overview about configuring my Wireshark settings so that someone else can maybe adjust their workflows as well.
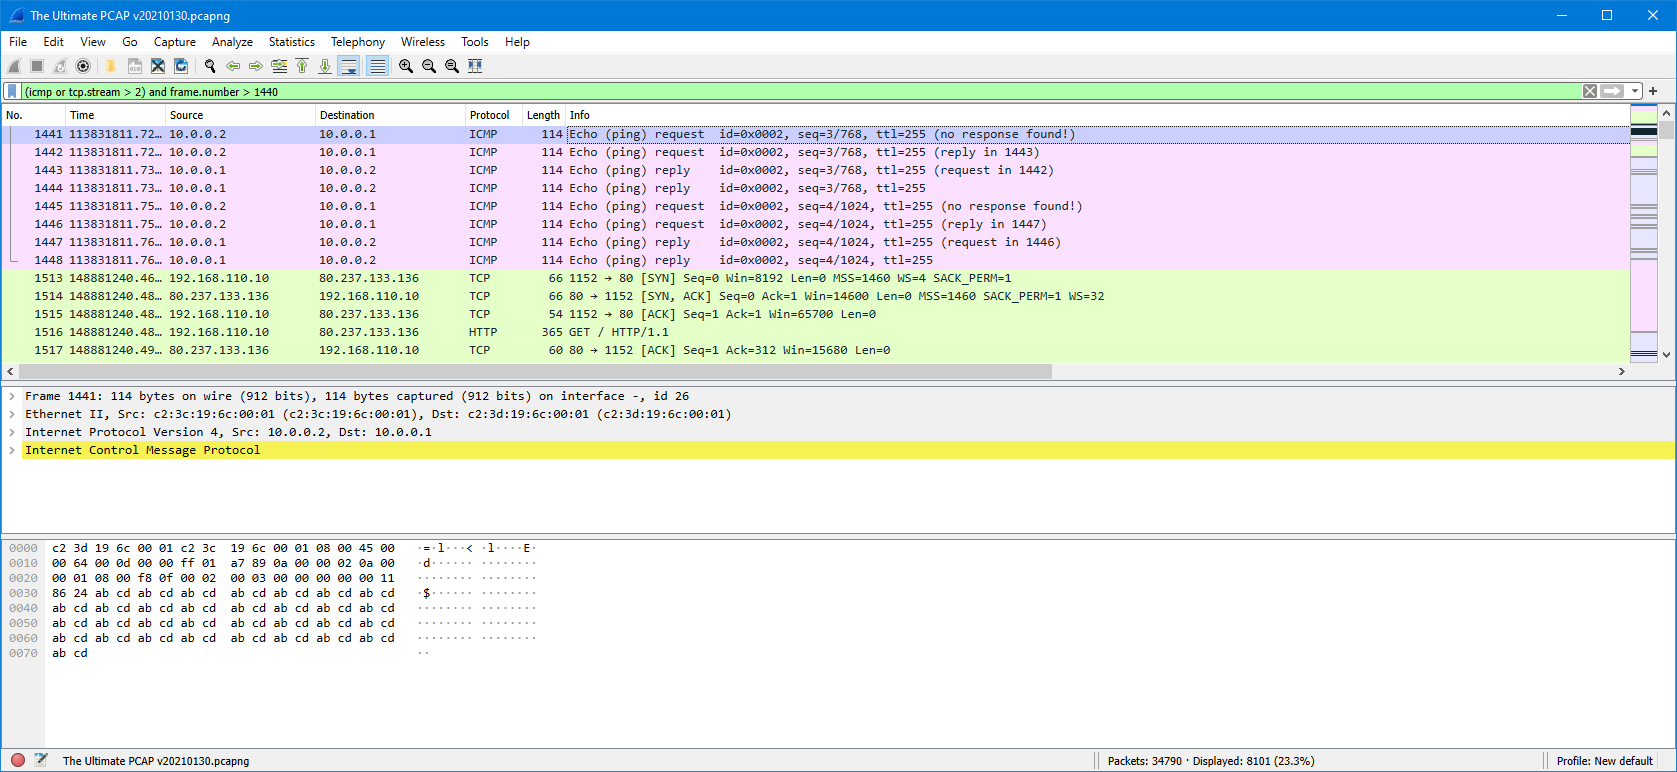
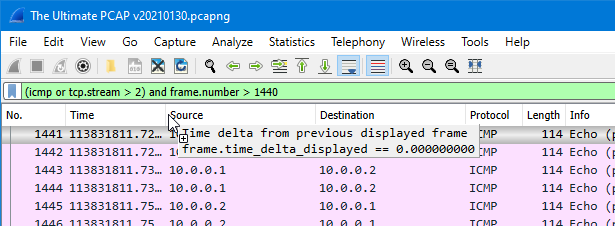
I have the latest Wireshark here, currently version 3.4.5. For the purposes of starting from the default setup I created a new profile (in Edit – Configuration Profiles) called “New default”. For the capture file I took The Ultimate PCAP by Johannes Weber. Because the file is too ultimate for my purposes 🤣 I entered a display filter “(icmp or tcp.stream > 2) and frame.number > 1440” in Wireshark, and this is how it looks like:
The first thing I’ll do is to add more space for the packet list, so let’s go to Edit – Preferences – Appearance – Layout, and select the second layout option there to move the packet bytes pane to the bottom right. Another thing I’ll do right away is to select the Gradient style for the active and inactive selected items in the Font and Colors page:
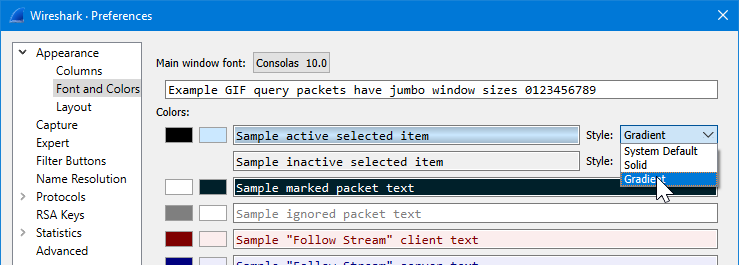
It will make the selected packet more recognizable in the packet list when coloring rules are in use.
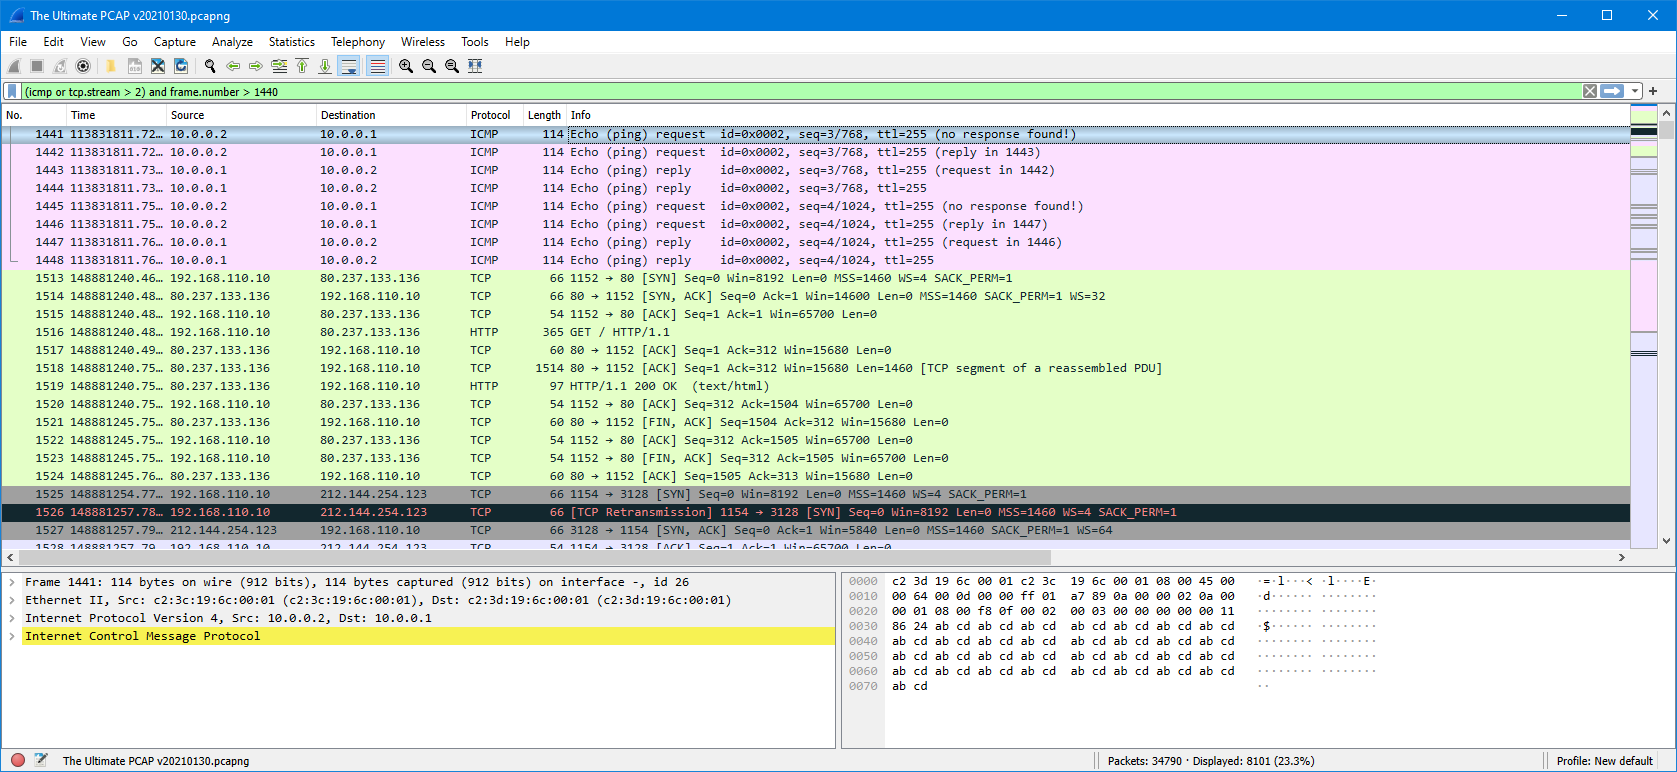
Now we have more packets on the screen at the same time, while still having the packet bytes visible:
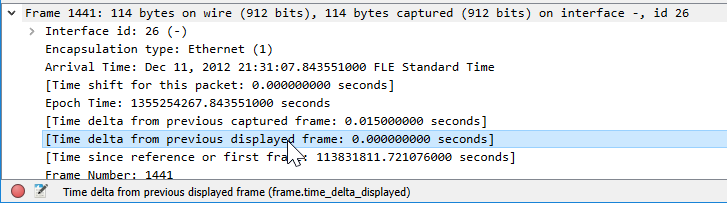
Now let’s add a new column for time display. One of the best ways to add new columns is to open the interesting data in the packet details pane and then drag the interesting field (“Time delta from previous displayed frame” in this case) and drop it to the packet list columns:
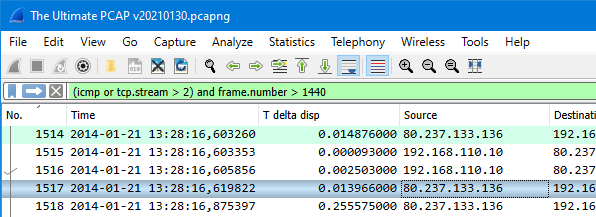
The resulting column will not be very finished, so right-clicking on the column and selecting Edit Column will get to editing mode. I’ll rename the new column to “T delta disp” and click OK. Also, in the View menu I’ll select Time Display Format “Date and Time of day” to get rid of the default time display mode in the Time column. Here we are now:
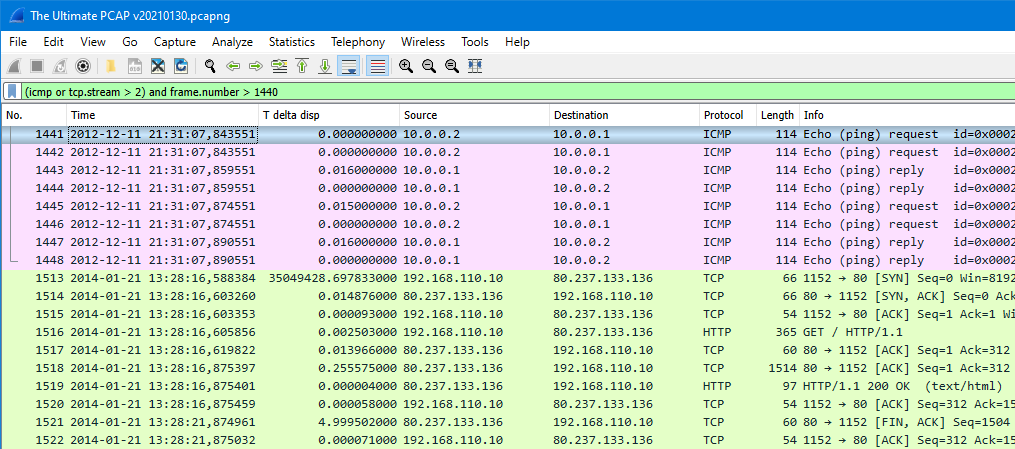
The delta time column is very useful in identifying gaps in the packet flow. In this example there is one unusually large delta time (over one year!) but that’s how it goes in every demo you know! Under that we can see a ~5-second gap (frame #1521), so that gives us a better example of this feature.
The time columns are something that I’ll always reconfigure on to go as needed in real use cases to show the exact time-related info that I need. Sometimes the seconds from the start of the capture is just fine, sometimes the absolute timestamp works better. Just always remember to take into account the differences in time zones and possible out-of-sync clocks.
Next, the coloring rules (View – Coloring Rules). My main idea for the coloring rules is that I want to recognize the TCP session creation and closure events, so I’ll first add three specific rules in the start of the list:
- TCP SYN = “
tcp.flags.syn == 1 && tcp.flags.ack == 0“, background color light green - TCP SYN+ACK = “
tcp.flags.syn == 1 && tcp.flags.ack == 1“, background color even lighter green - TCP FIN = “
tcp.flags.fin == 1“, background color light red
Then I’ll also disable some of the existing rules, like the HTTP rule, and this is what I get:
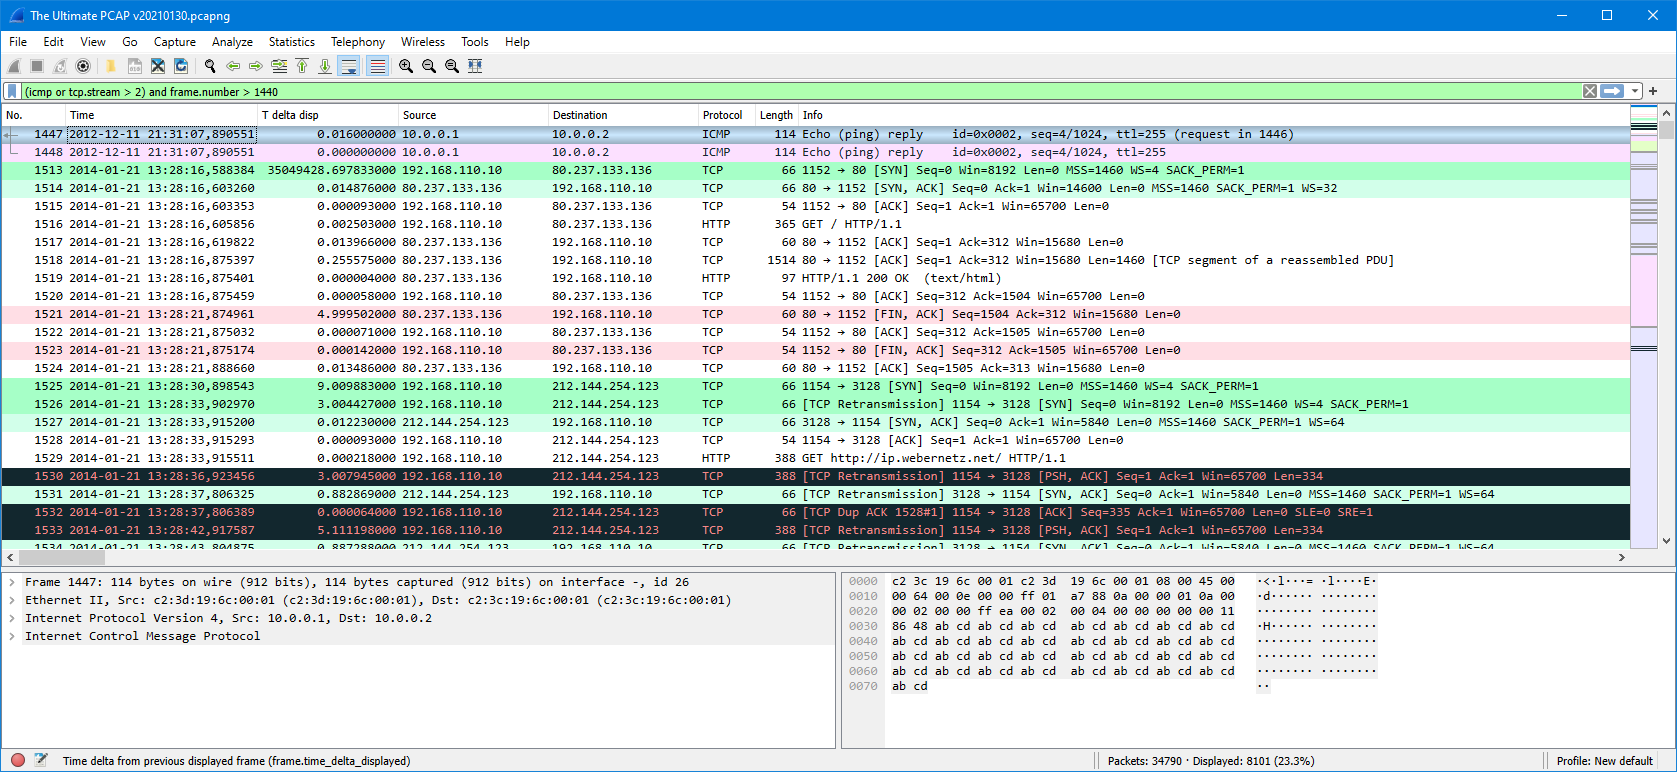
With these simple coloring rule changes it is now easy to identify new TCP sessions.
Other useful new columns are TCP-related (found under TCP in the packet details):
- TCP stream index
- TCP segment length
- TCP sequence number, next sequence number and ACK number
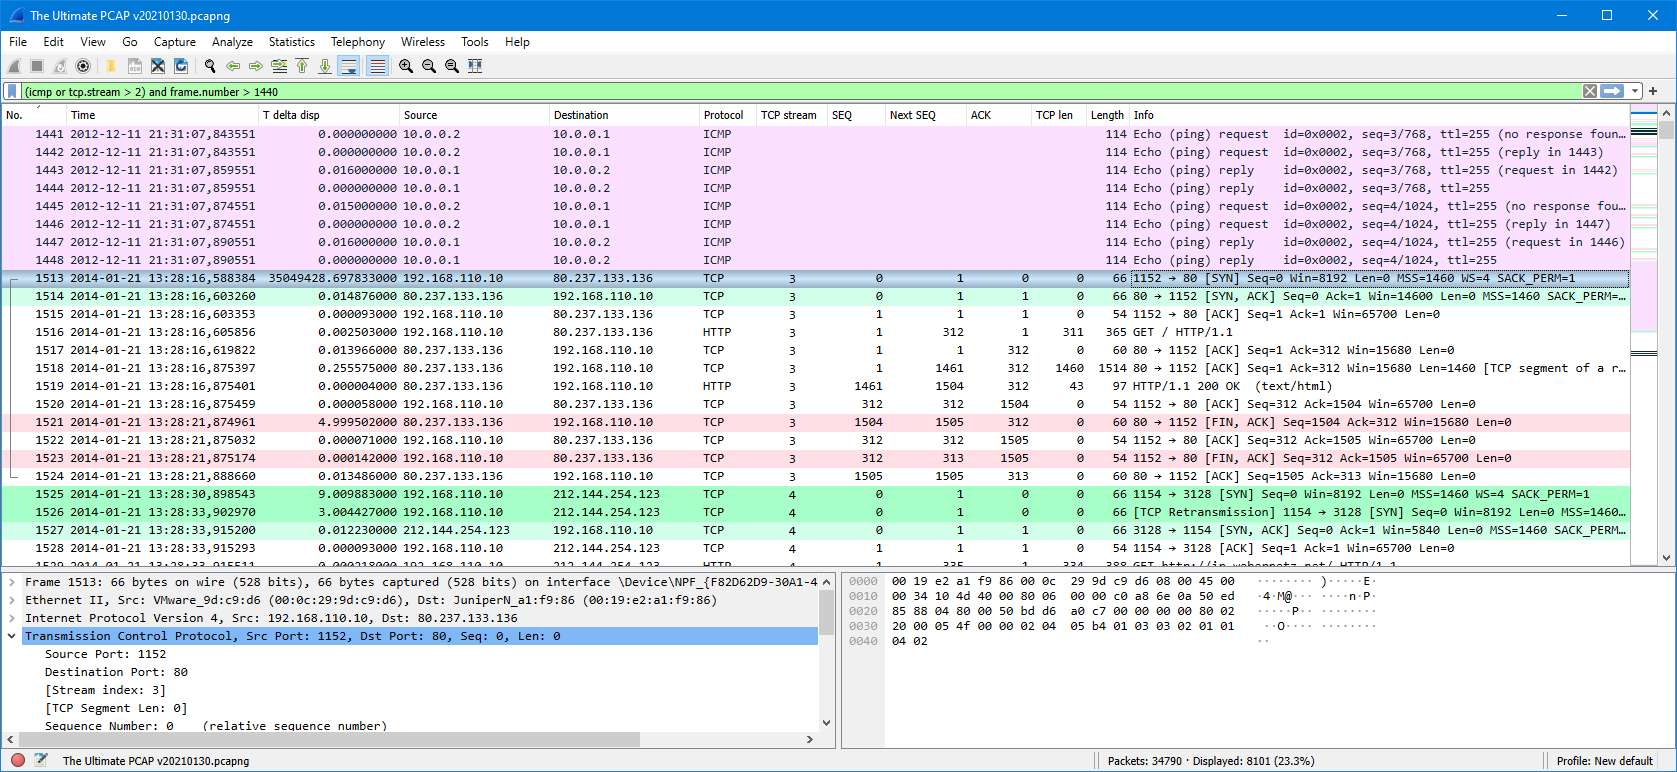
These new columns help identify problems (and confirm normal activity) in TCP sessions.
Not all the columns need to be visible all the time, you can always right-click on the columns and select or unselect any of the columns without losing the column configurations.
The final adjustment that I want to show is the alignment of the display filter field buttons: by right-clicking the display filter field there is an option “Left align buttons”. After selecting it the buttons are nearer to the usual place of mouse activity:
With these relatively small changes in the Wireshark profile configurations it is more efficient to work with Wireshark. Also note that it is possible to create different profiles for different use cases, and you can quickly switch between profiles by clicking the profile name in the bottom right of the status bar.