Log file monitoring in Zabbix means that the Zabbix agent in active mode will periodically check if the given log file has received new content that match the configured regular expression. Matched content is sent to the Zabbix server (or proxy, if the agent is monitored by a proxy) for further processing and storage. Zabbix server can then apply triggers for the log contents.
For moderate amounts of log contents this works just fine with the default settings. If the log files are growing fast, there are some settings that need to be adjusted to keep the monitoring working.
There are three locations to configure variables that affect the log file monitoring performance:
- The log item interval: Usually this is set to one second, to ensure fast reaction to new log lines in the monitored file
MaxLinesPerSecond(Zabbix agent) orPlugins.Log.MaxLinesPerSecond(Zabbix agent 2) configuration directive in the agent configuration file (default = 20)- Also the log item key parameters:
regexpparameter can be used to define required pattern (non-matching lines will be ignored) andmaxlinescan be set to override the agent-specifiedMaxLinesPerSeconddirective, which is handy as it takes effect without agent-side reconfigurations.maxdelayis also discussed later below.
Side note: Using the regexp parameter in the log item is the master gatekeeper to match only the interesting log lines for further processing. If you are configuring triggers to alert you about specific log events, that is a separate configuration process. In this post I’m not demonstrating any log triggers, just showing how to get the log lines through to Zabbix server, so that you can configure triggers.
Default maxlines
Let’s demonstrate the feature with the default MaxLinesPerSecond (or maxlines) setting.
First I’ll create the log item for my Zabbix 7.0.0 agent host:
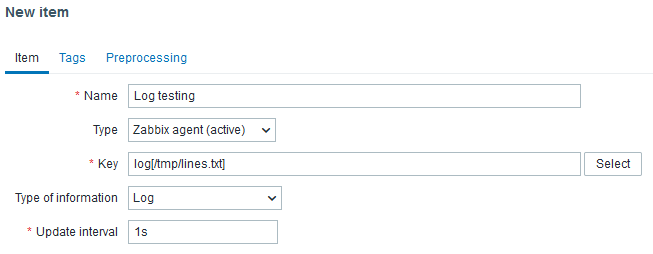
In the item key I only defined the file name, no regular expression, so this item will catch all lines that appear in the file. Type of information is Log, and update interval is one second.
To stop the agent from logging “active check “log[/tmp/lines.txt]” is not supported: Cannot obtain information for file “/tmp/lines.txt”: [2] No such file or directory” I create the empty test file: touch /tmp/lines.txt
Then I need some log data, and that is created with a small Python app (lines.py):
from datetime import datetime

with open("/tmp/lines.txt", "wt") as f:
    for i in range(1, 501):
        line = f"{datetime.now()} line {i}"
        print(line, file=f)
Running this (python3 lines.py) truncates the monitored file and prints 500 lines of output to it at once.
Let’s go back to Zabbix UI and open Latest data for the log item:
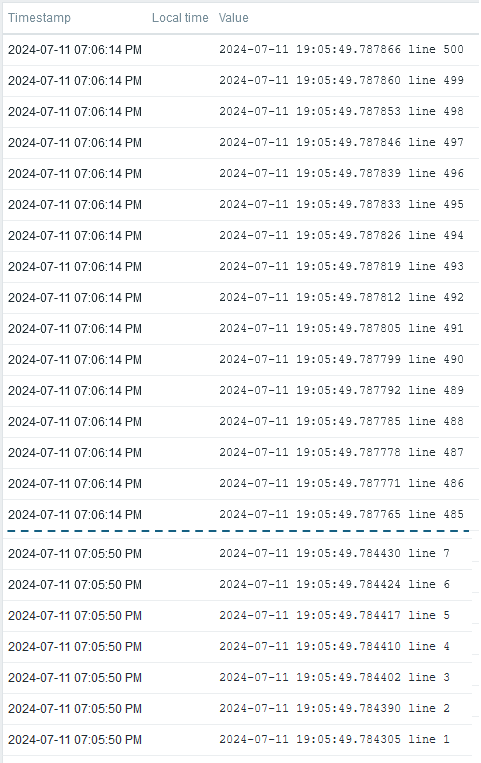
Not all 500 values are visible here (lines 8-484 were manually redacted from the picture) but we can still observe the effect of the current configuration:
- 20 lines of log contents were saved in Zabbix every second
- It took 25 seconds to send all 500 lines (500 / 20 = 25), even though all the lines appeared in the file within a few milliseconds.
This is definitely a problem if the log file grows faster than 20 lines every second.
Before adjusting anything, let’s see the MaxLinesPerSecond (or Plugins.Log.MaxLinesPerSecond) documentation more closely:
The maximum number of new lines the agent will send per second to Zabbix server or proxy when processing ‘log’ and ‘logrt’ active checks.
https://www.zabbix.com/documentation/current/en/manual/appendix/config/zabbix_agentd#maxlinespersecond
…
Note: Zabbix will process 10 times more new lines than set in MaxLinesPerSecond to seek the required string in log items.
The last sentence is a notable detail: If you are using the optional regexp parameter in the log[] item to find only specific matching lines and not just all lines from the log, the agent is able to skip uninteresting lines faster than just the maxlines setting says.
However, this also sets a limit for the performance of the log file handling: With the default settings, if the log file grows more than 200 lines per second (even though there is no match for the interesting lines!), the agent will not be able to keep up with the contents. If the situation is only temporary, the agent is able to catch the end eventually, otherwise the analysis will be late forever. Naturally the situation is even worse with the interesting lines as only 20 lines per second are sent to Zabbix server.
It should be noted that Zabbix is not meant or optimized for a general-purpose centralized logging service. The log file monitoring is useful for catching and saving specific events, not huge mass of logs.
The MaxLinesPerSecond setting or the overriding maxlines item parameter (with the default value of 20) thus provides protection for both server side and agent side: it protects the server from having to save more than 20 lines per second in the item history database, and it protects the agent from having to read and process more than 200 lines per second from the log file. You can then adjust the setting if you are prepared to handle more log data.
maxdelay
There is also an optional maxdelay parameter in the log items. If the agent is not able to keep up with the log file contents (due to MaxLinesPerSecond/maxlines restriction) and maxdelay is set to a positive (non-zero) value, the agent will start calculating an estimate about the delay it has in processing the lines. (You saw the example above where the log file suddenly received so many lines that it could not read them all at once, and it eventually took 25 seconds to clear them out.) If the estimated delay is shorter than the configured maxdelay, it will keep processing the lines normally. The lines will then arrive delayed, as demonstrated.
However, if the incoming amount of new log lines is so large that the estimated processing delay is longer than maxdelay, then the agent will jump over some of the data in the log file so that it can again meet the maximum delay requirement. This will result in some log lines being totally skipped and you will potentially lose some interesting lines that would have triggered actions in Zabbix server. Therefore the default is 0 (= the skipping feature is disabled), and you need to manually set it in the log item if this behavior is desired.
Personally I could imagine using maxdelay if the nature of the log file is such that I only need information about presence of some specific situation that is repeatedly announced in the log when the situation has started, but I don’t need to count the number of occasions or to know the exact timestamp when the first one occurred.
Let’s see the maxdelay parameter in action. I’ll reconfigure the log item with maxdelay value of 5:
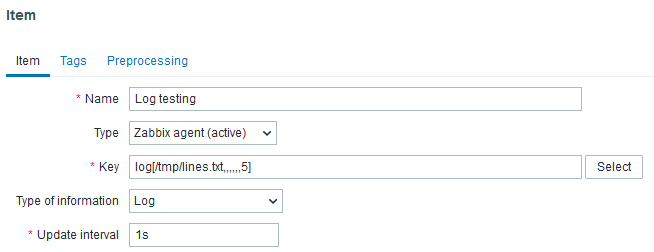
The number of commas there is significant as the signature of the log[] item is “log[file,<regexp>,<encoding>,<maxlines>,<mode>,<output>,<maxdelay>,<options>,<persistent dir>]“, so there are exactly 6 commas before the maxdelay value.
After waiting for some 15 seconds to ensure that the configuration has been synced via the proxy to the active agent, let’s send the 500 timestamped values to the file again:
python3 lines.py
Just about immediately this was logged in the Zabbix agent log:
11080:20240711:191715.506 item:"log[/tmp/lines.txt,,,,,,5]" logfile:"/tmp/lines.txt" skipping 13750 bytes (from byte 691 to byte 14441) to meet maxdelay
Also, when checking the latest data for the log item there is a gap in the observed line numbers:
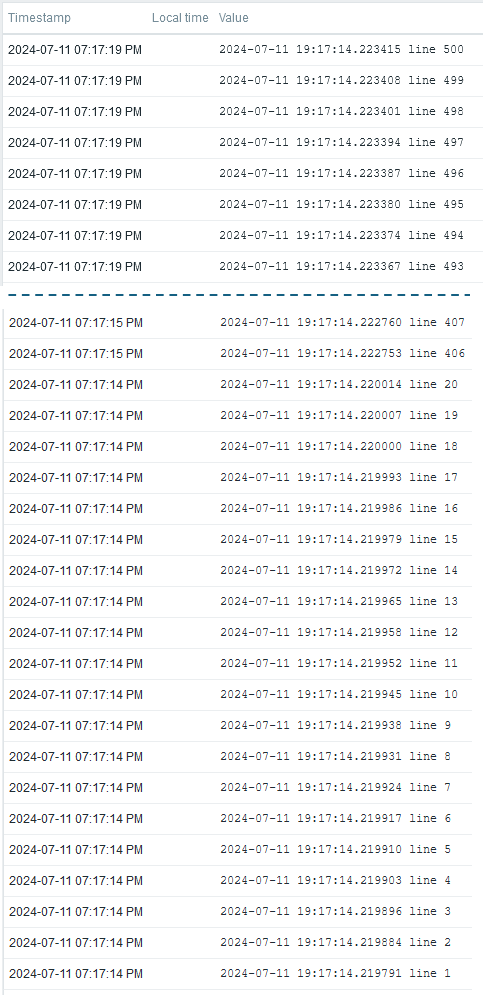
See how the line number jumped from 20 to 406 at once (the lines 408-492 were just removed from this picture manually). More detailed analysis:
- First the agent processed and sent the first 20 lines as expected (
MaxLinesPerSecondandmaxlinesare at the default value of 20) - In the next round (after 1 second) it realized that the file was growing so fast that the estimated completion time is exceeding the configured
maxdelayof 5 seconds - It calculated the estimate of where to jump (i.e. how many lines to skip) to complete the rest of the lines in 5 seconds
- It started sending the rest of the lines, 20 lines per second
- Completed after total of 6 seconds: 1 second for the first round, then it spent
maxdelayseconds to send the rest of the data - But lines from 21 to 405 were never processed by the agent so they were just skipped.
In this example the file didn’t grow after the file inspection was started so it was enough to do the skipping just once. In reality, if the situation continues, the agent will skip some lines again and again to keep the maximum delay for the lines within the maxdelay value.
Takeaways
When using the log items be mindful of the amount of log you will need to handle. For high-volume logs ensure that you are using the regexp parameter to pick only the interesting lines, and adjust the maxlines parameter (or agent-level MaxLinesPerSecond directive) if you need to boost the log file reading. Only use maxdelay parameter if you are able to tolerate skipping some lines in temporary high-volume logging situations.